


Dữ liệu Cung/Cầu Điện và Dòng Điện của các Kết nối Liên vùng tại Nhật Bản được Định dạng thành Biểu đồ và Bản đồ Trực quan
Viện Năng lượng Tái tạo đã ra mắt một mục mới trên trang web của mình, cung cấp thông tin về "dữ liệu ghi chép cung & cầu điện" và "dữ liệu ghi chép dòng điện của các đường dây kết nối liên vùng" tại các khu vực TSO của Nhật Bản (chín khu vực TSO không bao gồm khu vực Điện lực Okinawa).
Trang web được xây dựng dựa trên dữ liệu do các TSO và OCCTO công bố từ tháng 4 năm 2016, cho phép bạn trực quan hóa và phân tích dữ liệu thu thập được dưới dạng biểu đồ và bản đồ của Nhật Bản. Giá giao ngay của thị trường JEPX theo ngày cũng có sẵn.
Bạn có thể xem tình trạng điện của chín khu vực tại Nhật Bản và tùy chỉnh biểu đồ theo nhu cầu của mình một cách tương tác. Chúng tôi hy vọng đây sẽ là một công cụ hiệu quả cho những người tìm kiếm thông tin và hỗ trợ các nghiên cứu khác nhau, thúc đẩy và tạo điều kiện thuận lợi cho các quyết định chính sách về quá trình chuyển đổi năng lượng của Nhật Bản.
Tổng quan
URL: https://www.renewable-ei.org/en/statistics/electricity/
(TOP > Thống kê > Biểu đồ & Bản đồ)
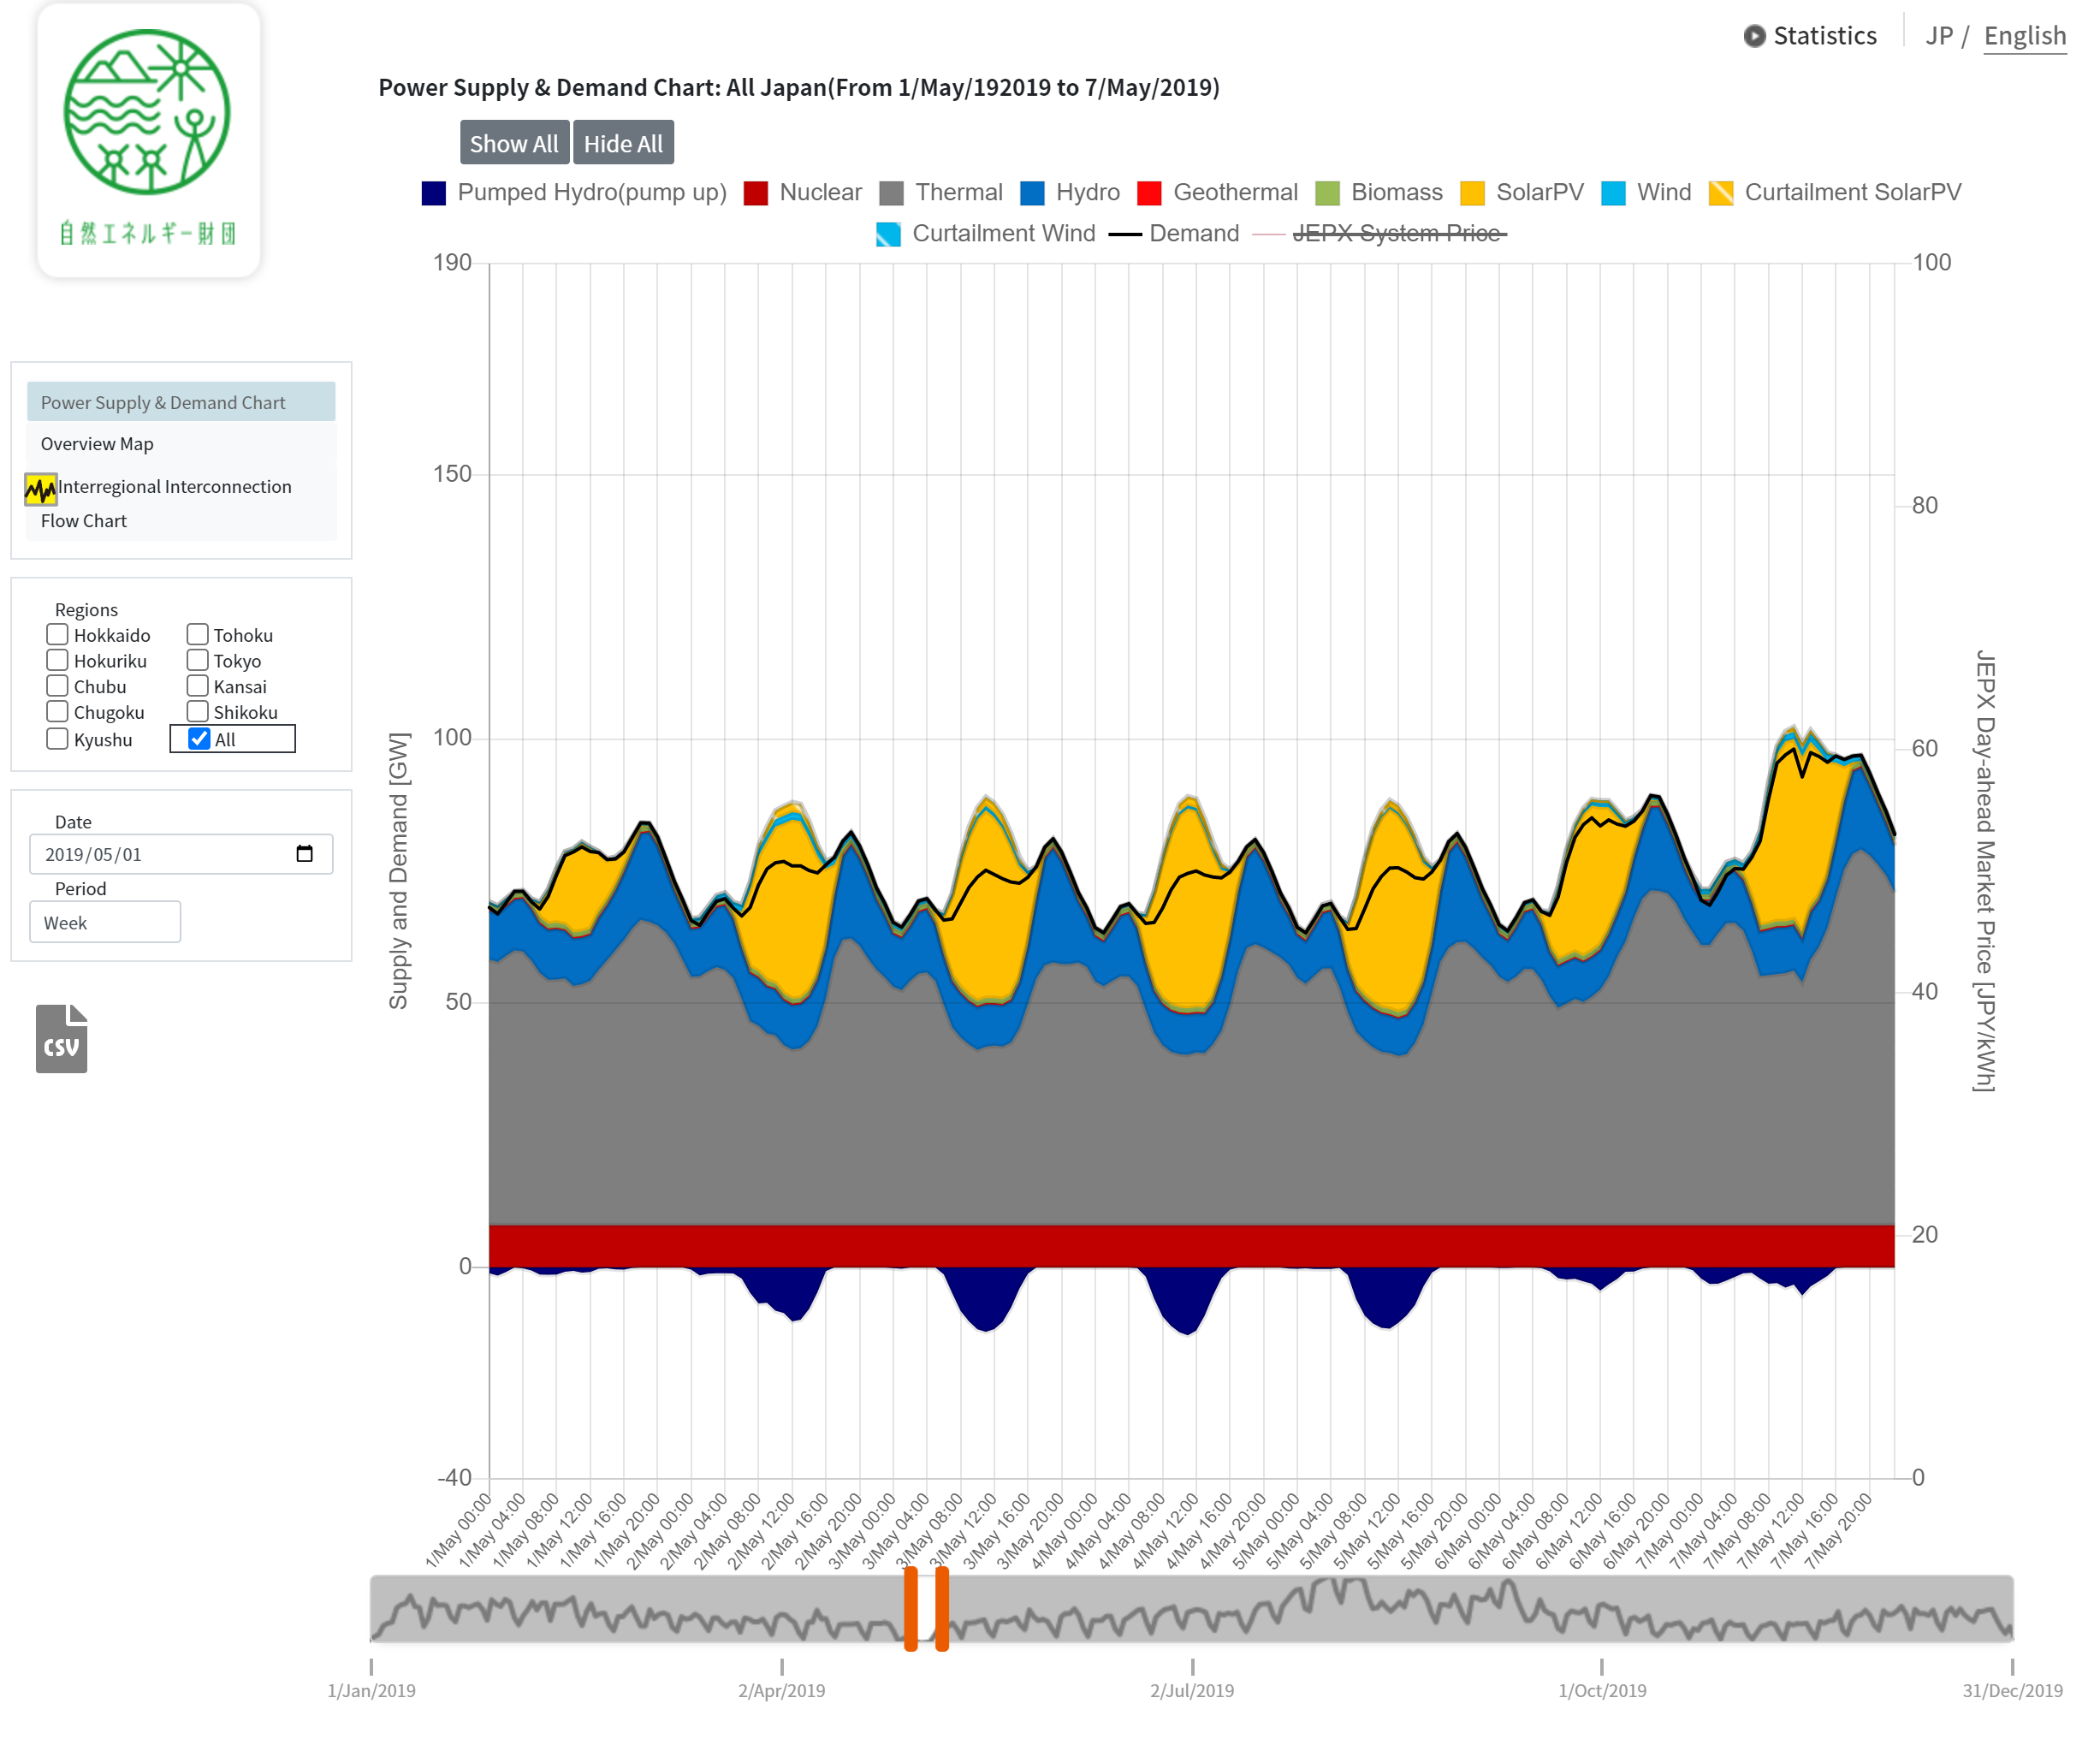
1. Biểu đồ Cung & Cầu Điện tại Nhật Bản
Sử dụng dữ liệu ghi chép cung và cầu điện tại chín khu vực của TSO.
Các tính năng chính như sau:
(1) Bạn có thể xem khoảng thời gian bằng cách chọn ngày và thậm chí chọn khoảng thời gian bằng cách trượt thanh ở cuối biểu đồ.
(2) Bạn có thể hiển thị tổng số của nhiều khu vực đã chọn.
(3) Bạn cũng có thể chọn xem giá giao ngay của thị trường giao dịch ngày trước JEPX.
Lưu ý: Thị trường giao dịch ngày trước JEPX được giao dịch theo đơn vị 30 phút, nhưng biểu đồ hiển thị giá trung bình theo giờ theo định dạng cung và cầu điện do TSO cung cấp. Sản lượng điện sản xuất bằng thủy điện được hiển thị trong sản lượng điện sản xuất bằng thủy điện.
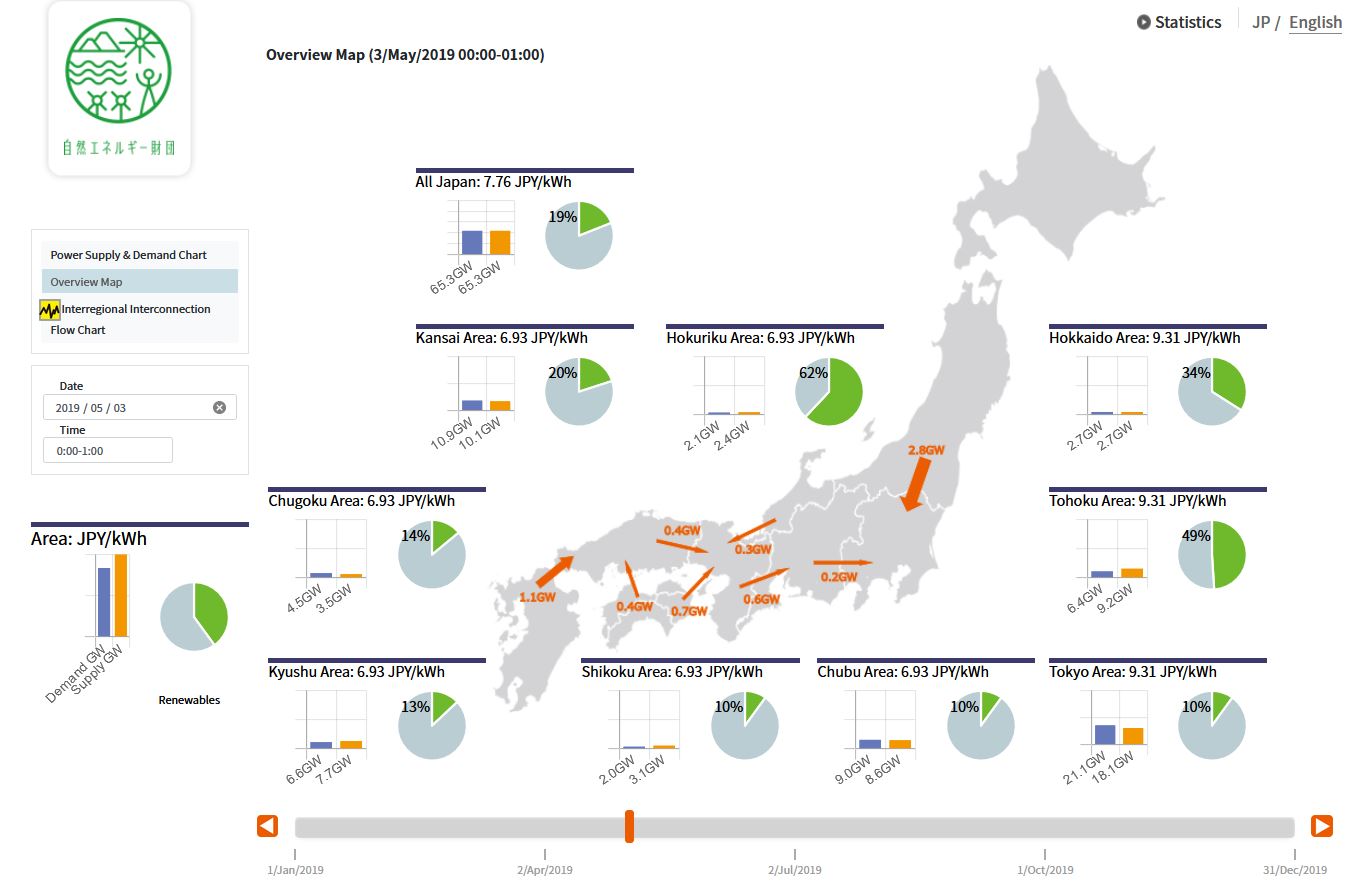
2. Bản đồ Cung cầu Điện năng và Dòng điện của các Kết nối Liên vùng
Thông tin hàng giờ của mỗi khu vực chín TSO được trình bày và trực quan hóa bằng bản đồ Nhật Bản. Cung cầu điện năng của mỗi khu vực được hiển thị dưới dạng biểu đồ cột, và tỷ lệ sản lượng điện năng tái tạo so với nhu cầu được hiển thị dưới dạng biểu đồ tròn. Bản đồ cũng có thể cung cấp cho bạn giá thị trường JEPX trong ngày và dòng điện thực tế của các kết nối liên vùng.
Lưu ý: Thị trường JEPX trong ngày được giao dịch theo đơn vị 30 phút, nhưng biểu đồ hiển thị giá trung bình hàng giờ theo dữ liệu cung cầu điện năng do các TSO cung cấp. Sản lượng điện sản xuất bằng thủy điện được hiển thị trong sản lượng điện sản xuất bằng thủy điện. Lưu lượng điện thực tế của dữ liệu kết nối liên vùng do OCCTO cung cấp trên trang web của mình là 5 phút một lần, nhưng tại đây, dữ liệu được xử lý và hiển thị dưới dạng giá trị trung bình trong 60 phút theo định dạng dữ liệu cung cầu điện do các TSO cung cấp.
3. Biểu đồ lưu lượng điện của các kết nối liên vùng
Biểu đồ hiển thị dữ liệu lưu lượng điện thực tế theo giờ của mười kết nối liên vùng tại chín khu vực ở Nhật Bản.
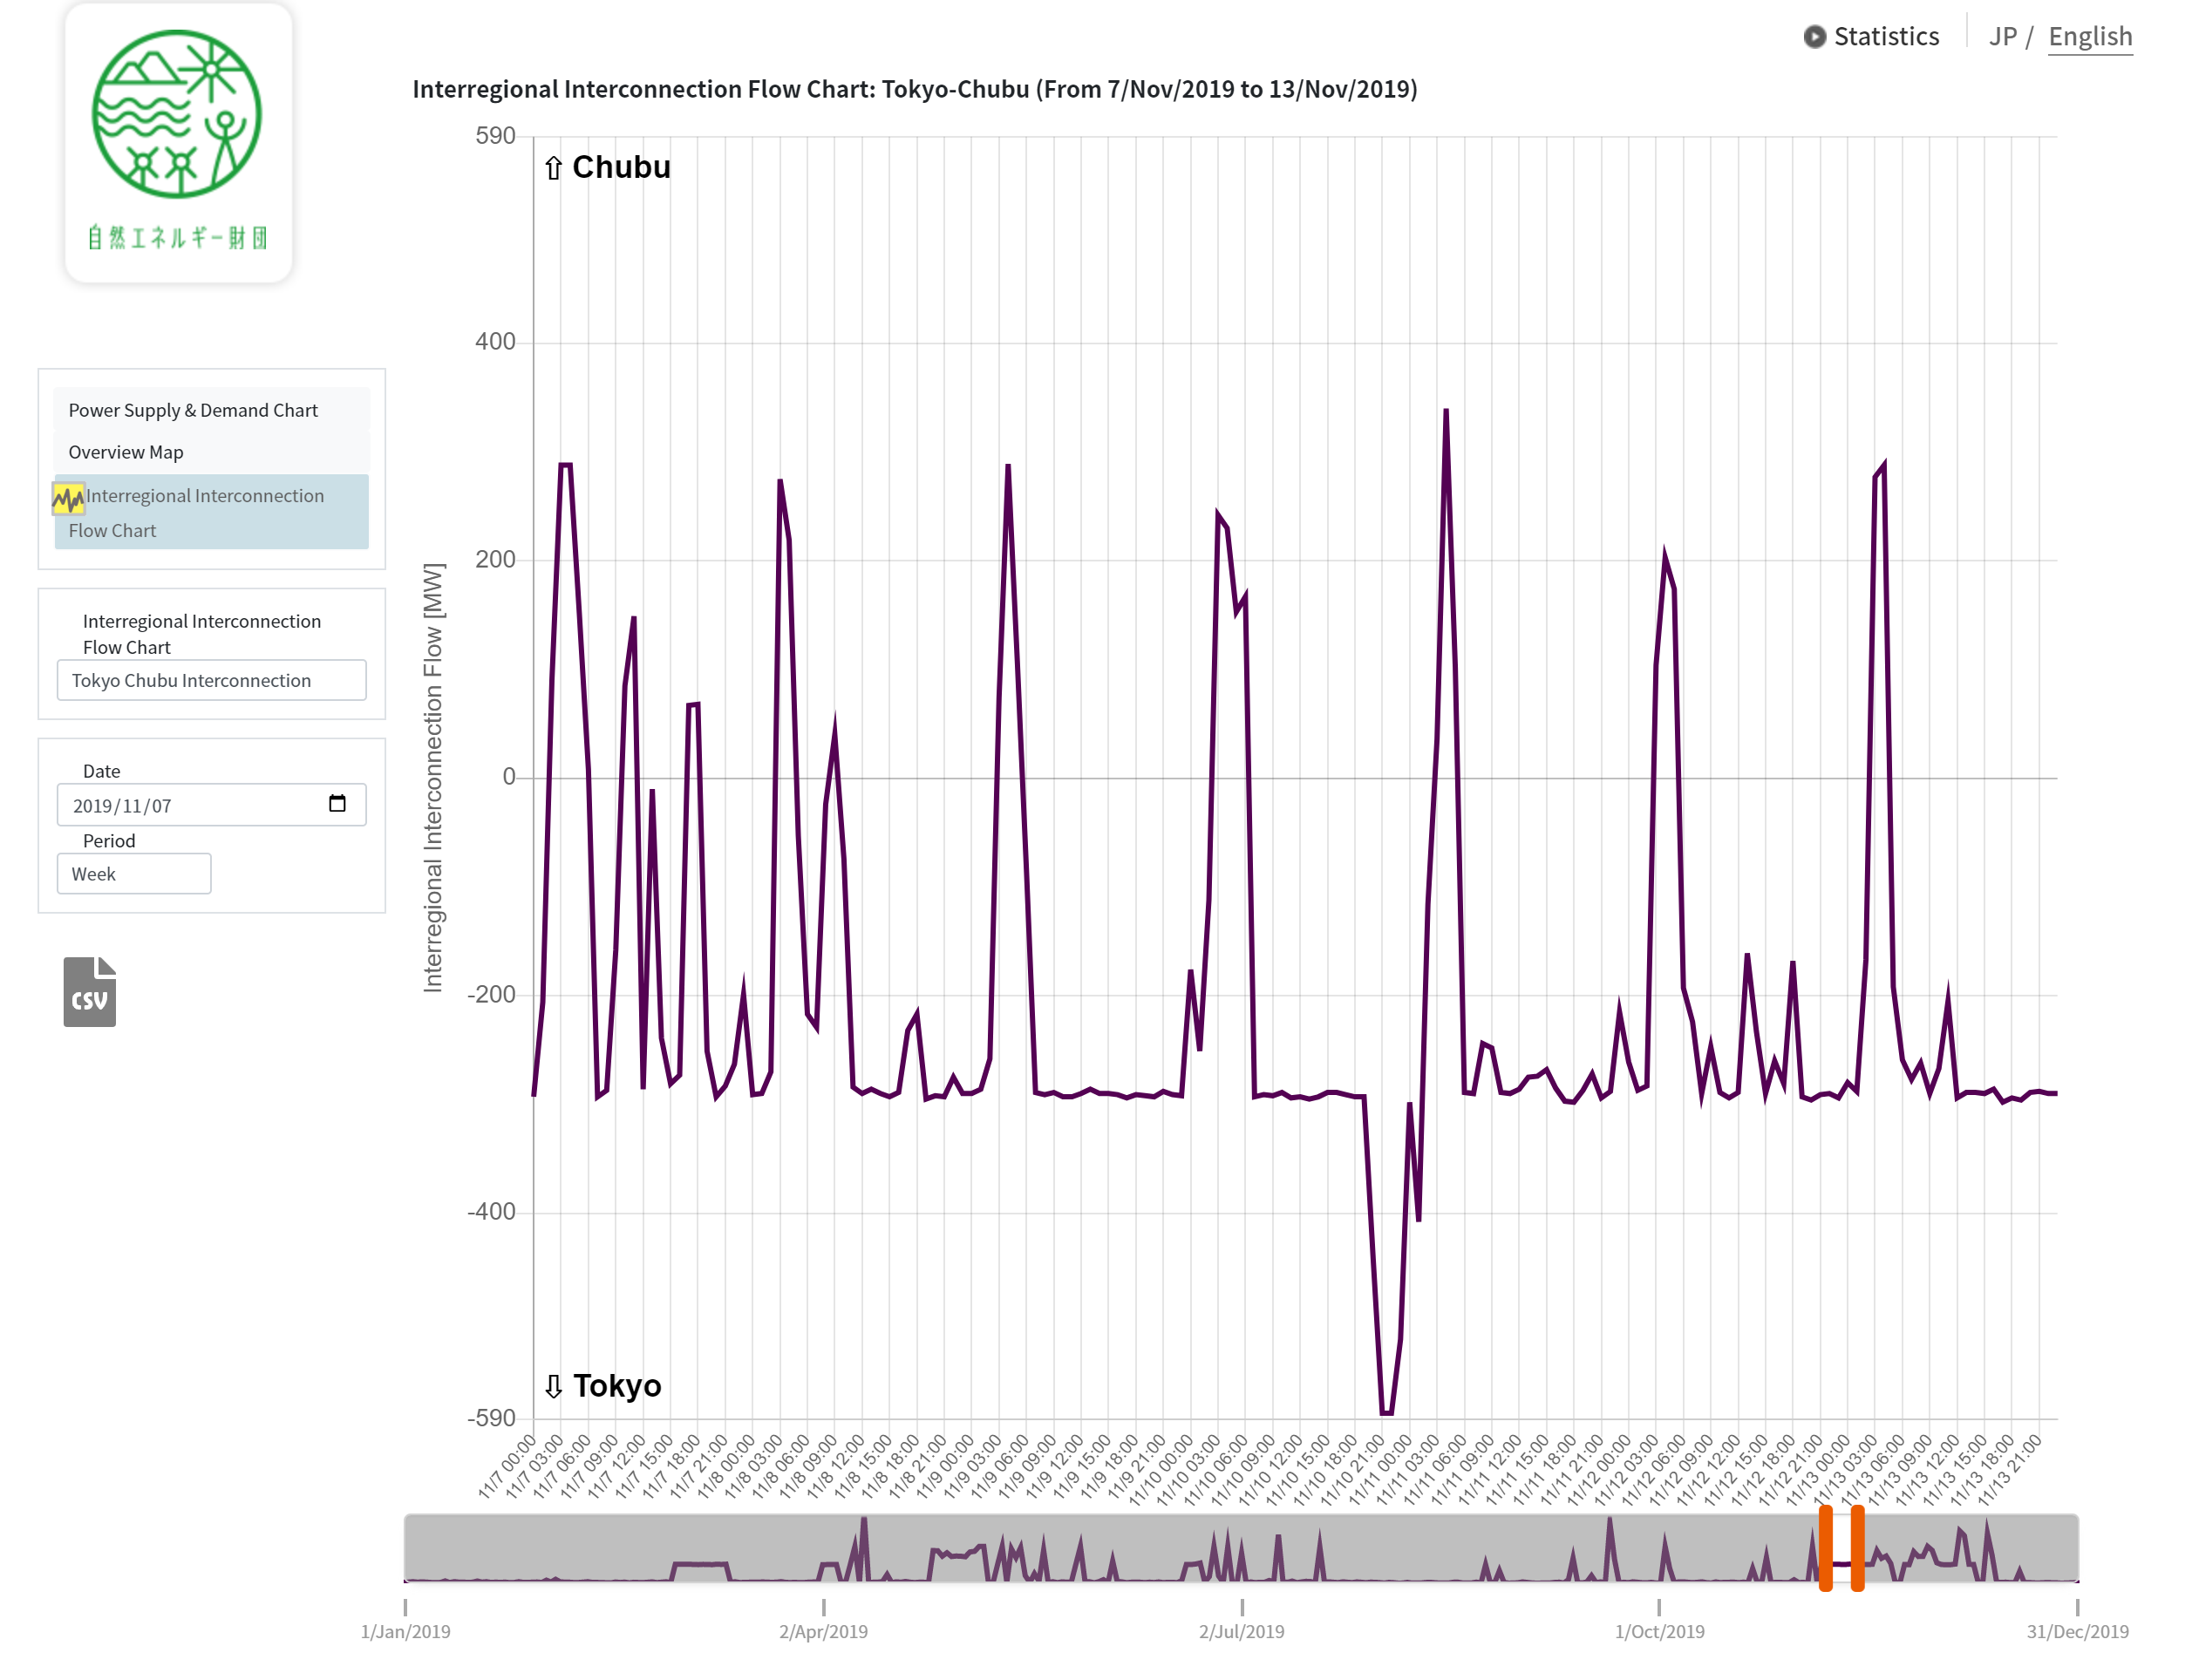
Lưu ý: Dữ liệu lưu lượng điện của các kết nối liên vùng do OCCTO công bố được tính là 5 phút một lần, nhưng tại đây, dữ liệu được hiển thị dưới dạng giá trị trung bình trong 60 phút theo định dạng dữ liệu cung cầu điện do các TSO cung cấp.
Chu kỳ dữ liệu và tần suất cập nhật
Dữ liệu về cung cầu điện được tính từ ngày 1 tháng 4 năm 2016, và dữ liệu về lưu lượng điện của các kết nối liên vùng được tính từ ngày 1 tháng 6 năm 2016. Tần suất cập nhật dữ liệu được lên kế hoạch mỗi tháng một lần, dữ liệu mới nhất là dữ liệu thực tế của hai tháng trước đó.
(Ví dụ) Dữ liệu tháng 5 năm 2020 sẽ được cập nhật vào giữa tháng 7 năm 2020.
Tuyên bố miễn trừ trách nhiệm về dữ liệu
Mặc dù chúng tôi đã nỗ lực hết sức để đảm bảo thông tin chính xác mới nhất có sẵn trên trang web, Viện Năng lượng Tái tạo không chịu trách nhiệm về tính chính xác của thông tin. Dữ liệu do các TSO và OCCTO công bố có thể được điều chỉnh hồi tố, và dữ liệu trên trang web cũng có thể được điều chỉnh cho phù hợp.


