


GHG emissions of hydrogen and its derivatives, from Global Hydrogen Review 2024 of IEA
Edited by VAHC Secretariat
Highlights
In 2023, global hydrogen production emitted 920 Mt CO2. Nearly two-thirds of production was from unabated natural gas, which emits 10-12 kg CO2-equivalent (CO2-eq)/kg H2; about 20% was from unabated coal, which emits 22-26 kg CO2-eq/kg H2. Between 75% and 95% of these emissions occur directly at the point of production, and can be reduced by carbon capture, utilisation and storage (CCUS). For hydrogen from steam methane reforming (natural gas), abatement costs are estimated at around USD 60-85/t CO2 for capture rates of 55-70%, and USD 85-110/t CO2 for rates above 90%. However, carbon capture alone is not sufficient; upstream and midstream emissions must also be tackled.
Hydrogen from electrolysers is emissions-free at the point of production, and so emissions depend on the electricity used. Emissions intensity from electricity generation should be below 200-240 g CO2/kWh for emissions to be lower than steam methane reforming. Renewable electricity is emissions-free at the point
of generation, but embedded emissions can occur in the construction and manufacturing of renewable assets. Such emissions are currently not included in most standards and schemes; they can range from 0.4-2.7 kg CO2-eq/kg H2.
The process of converting hydrogen to a carrier for transport incurs energy losses of 45-70%. This means that any GHG emissions from the electricity input to the electrolysers increases by a factor of 2-3 in terms of the final hydrogen delivered. The lowest emissions are achieved when the electrolyser uses renewable electricity, and the hydrogen transported is used as shipping fuel and no fossil fuels are used in hydrogen recovery. Liquid hydrogen results in the lowest emissions due to its higher pathway efficiency (above 50%); emissions are slightly higher for liquid organic hydrogen carriers (LOHC) and ammonia.
The emissions reduction offered by carbon-containing hydrogen-based fuels is greatest when the CO2 source is biogenic or from the air. The emissions intensity of their electricity input should be lower than 160-190 g CO2-eq/kWh for synthetic methanol and 95-140 g CO2-eq/kWh for synthetic methane and kerosene to result in lower emissions compared to a fossil fuel. In emissions accounting, the way CO2 emitted during fuel combustion is allocated along processing steps in the supply chain has a large effect on the total emissions allocated to the individual product.
Overview
In 2023, global production of 97 Mt of hydrogen emitted92 nearly 920 Mt CO2 (Chapter 3. Hydrogen production). This is equivalent to the annual energy-related emissions of Indonesia and France combined. In the IEA Net Zero Emissions by 2050 Scenario (NZE Scenario), these emissions must go down by around 10% to 820 Mt CO2/yr by 2030. At the same time, in this scenario total hydrogen production needs to increase by over 50% to 150 Mtpa, which means that the reduction required in terms of specific emissions is more significant than in absolute terms, with a 40% drop needed by 2030 to reach ~5.5 kg CO2/kg H2. A hydrogen molecule does not contain any carbon, which means the CO2 emissions do not come from the end use, but rather from the production, processing and transport of hydrogen. Carbon accounting must therefore track the CO2 emissions at each conversion step in the supply chain. The framework used to account for and report on GHG emissions is of critical importance for the trade of low-emissions hydrogen, especially as traded hydrogen may cross borders and jurisdictions, and the majority of the GHG emissions occur upstream in the supply chain, during production and transportation.
A large number of certification schemes and regulations (see Box 6.3 for clarifications on certification-related terminology) have emerged in the past 3 years (see Figure 7.1), using different boundaries, production routes, definitions, emissions thresholds and methodologies for varying products. Nevertheless, there have been signs of convergence in the past year. The publication of the International Organization for Standardization (ISO) Technical Specification for the hydrogen supply chain from production to consumption gate will set the basis for the ISO standards to be published in the next 2 years. At the multilateral level, the COP 28 Declaration of Intent on mutual recognition of certification schemes, and regional efforts in Latin America for a common certification scheme (CertHiLAC) demonstrate strong commitment to establishing common standards.
The IEA H2 Technology Collaboration Programme (TCP) Task 47 and the International Partnership for Hydrogen and Fuel Cells in the Economy (IPHE) Hydrogen Certification Mechanisms (H2CM) Task Force are two global initiatives that have joined efforts to develop an evidence base on the current certification mechanisms and to support building consensus and mutual recognition across schemes. These efforts must continue in order to ensure that accounergy Association, originally proposed in 2021 and currently under development. In total, ten schemes (of which five are regulatory) cover both hydrogen and its derivatives.
Seven (three regulatory) of these are already operational. European schemes do not define a specific production route, and only specify a GHG threshold that any hydrogen (or derivative) should achieve, as well as the methodology to be used. Ammonia is most common among schemes that explicitly mention the carriers. Steel is exclusively mentioned in the (voluntary) Zero Carbon Certification Scheme.
System boundaries and scope of emissions
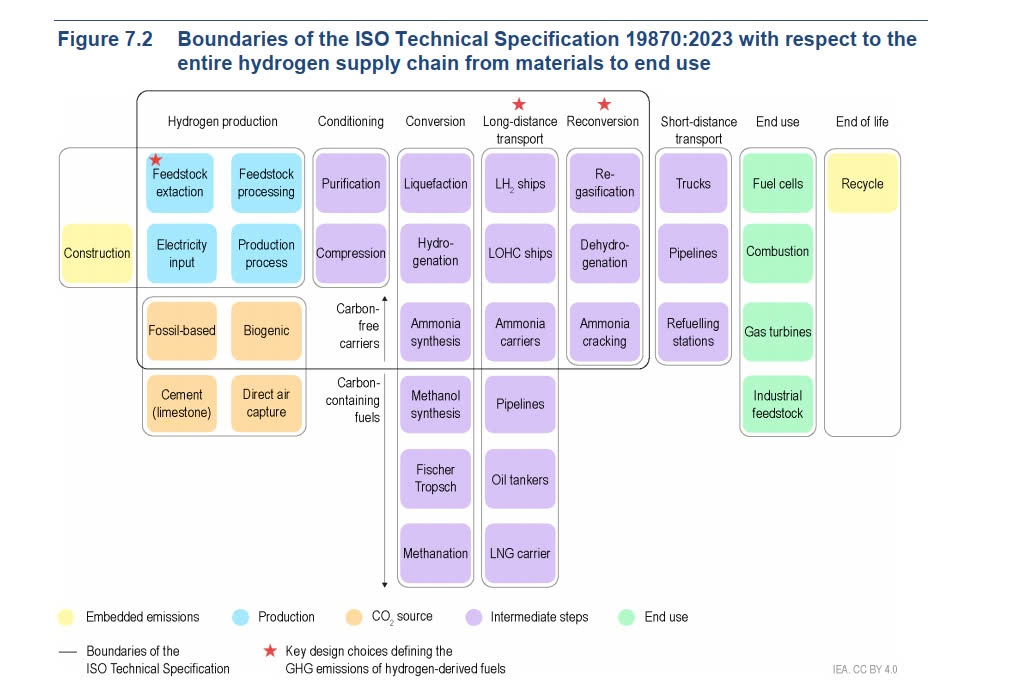
This report uses the boundaries and methodology of the ISO Technical Specification (Figure 7.2), which may eventually be used as a common basis for future regional and national methodologies. The supply chain steps covered in the specification areGlobal hydrogen production, conditioning, conversion to hydrogen carriers, transport, and reconversion to hydrogen. Emissions associated with the electricity input and upstream and midstream methane emissions are included. Emissions from construction, manufacturing, and decommissioning of assets are excluded from the scope, but their quantification should be provided separately for information. With a well-to-gate scope, only the end use is excluded.
The ISO Technical Specification currently covers hydrogen carriers that are expected to be reconverted back to gaseous hydrogen (liquefied hydrogen, LOHC and ammonia), including cases where they are used directly (as for ammonia). Carboncontaining synthetic fuels such as methane, methanol and other hydrocarbons are excluded from the scope. These can be used directly as fuels due to their higher volumetric energy density (compared to pure hydrogen carriers) and existing infrastructure that facilitates transportation to the end use.
Global warming potential (GWP) (which covers GHG emissions) is one of several categories typically covered in a Life Cycle Assessment (LCA) analysis. The rest of this chapter will focus only on GHG emissions, but the total environmental impact of
hydrogen must be assessed considering criteria across all the impact categories. Beyond the environmental aspect, other dimensions such as social aspects or cost can necessitate trade-offs when designing a plant or making a final investment decision on a project, but these factors are not included in this analysis. Supply chain efficiency is defined in this report as the energy finally delivered as hydrogen compared to the total energy input along the supply chain. As a result, design changes, like the use of hydrogen that has been transported to provide the heat for ammonia cracking and LOHC dehydrogenation, or as a shipping fuel, will decrease the efficiency (and increase the specific GHG emissions), since this
hydrogen consumption along the chain reduces the hydrogen finally delivered.
Emissions intensities of hydrogen production routes
This chapter updates previous IEA analysis on emissions intensities of hydrogen production routes. The updates introduced here are consistent with the ISO Technical Specification, and based on updated data on upstream and midstream methane emissions from 2022, and updated technical parameters for some of the conversion
processes. This section focuses on hydrogen production, meaning that the scope is well-to-gate.
For production pathways using natural gas and coal without carbon capture and storage (CCS),94 direct emissions during hydrogen production represent as much as 75-95% of the total emissions. Hydrogen produced from natural gas emits 10-12 kg CO2-eq/kg H2, with the range coming from the difference in upstream and midstream GHG emissions95 (Figure 7.3). Emissions from hydrogen production from coal are higher, at 22-26 kg CO2-eq/kg H2. CCS can be used to reduce the direct emissions, with the capture rate and abatement cost depending on the technology pathway and the point of capture. Capture rates for steam methane reforming (SMR) are the lowest (55-70%) when carried out only in the concentrated stream on the process side, which also results in the lowest abatement cost (USD 60-85/t CO296). When capture is also implemented on the flue gas, which is more diluted and has lower pressure, the capture rate can increase above 90%, but the cost also increases to USD 85-110/t CO2. Process modelling studies have shown that plant capture rates of 96% and up to 99% can be technically and economically feasible. Using electricity instead of natural gas to achieve the high temperatures needed for reforming is also an option, but this would tackle only the emissions from fuel combustion, which are around 45% of the total, and therefore mitigation of the emissions from the process side would still be required. For autothermal reforming, capture rates can be 93-98% since most of the CO2 is on the process side at high pressure. The gas partial oxidation (POx) process developed by Shell is reported to yield overall plant capture rates up to 99%, although these high capture rates are yet to be proven in large-scale commercial plants on a continuous basis.
Once CCS is implemented, the upstream and midstream GHG emissions become the dominant factor, accounting for up to 98% of the total emissions when partial oxidation of natural gas with 99% capture is applied. Upstream and midstream GHG emissions can make up to 90% of the total for production from coal (when a 98%
capture rate is applied), due to higher residual emissions from carbon capture.
For production using natural gas, the global average upstream and midstream emission intensity in 2022 was 11.3 kg CO2-eq/GJNG,97 which corresponds to 20% of the CO2 produced during the combustion of the natural gas, and is equivalent to about 1.8 kg CO2-eq/kg H2.98 These emissions alone would be four times higher than the lowest threshold defined in the production tax credit in the United States (0.45 kg CO2-eq/kg H2) and 60% of the threshold defined in the EU Taxonomy. There is a wide spectrum of natural gas emissions intensity around the world. At the lower bound, Norway has an upstream and midstream emissions intensity of 4.5 kg CO2-eq/GJNG (0.7 kg CO2-eq/kg H2), compared to up to 27 kg CO2-eq/GJNG (4.3 kg CO2-eq/kg H2) for Turkmenistan. The solutions to mitigate upstream and midstream emissions are known and cost-effective. In the NZE Scenario, the global average upstream and midstream emissions intensity of natural gas would be halved by 2030. Reliable methane emissions inventories are critical to establish baselines, define targets and track progress. National emission inventories are known to underestimate these emissions, but other efforts in recent years have made progress in closing this gap. Clear and standardised measurement, monitoring, reporting and verification (MMRV) guidelines are also essential to ensure the interpretation of the emissions measured. For example, in 2020 the United Nations Environment Programme (UNEP) launched the Oil and Gas Methane Partnership 2.0 (its flagship oil and gas reporting and mitigation programme), which has developed guidance for methane measurement. The EU Methane Regulation introduces mandatory MMRV requirements on domestic producers and establishes a transparency platform with country profiles (including non-EU member states exporting to the European Union).
There are also government efforts aiming to measure and reduce these emissions like the Global Methane Pledge, which is supported by countries covering 50% of global anthropogenic emissions and targets 30% reduction by 2030 (compared with 2020). In November 2023, the US Department of Energy (DoE) announced an international working group, composed of 14 members, to establish an MMRV framework for providing comparable and reliable information to natural gas market participants.
For production using coal, upstream and midstream emissions can make even a larger difference. Even with a capture rate of 98%, the upper end of upstream and midstream emissions would result in total emissions from hydrogen production above 5 kg CO2-eq/kg H299 (for coal), which is more than half the most common conventional production route today (from natural gas) and above most low-carbon thresholds that have been defined in certification schemes (see Chapter 6. Policies).
For hydrogen production using water electrolysis, emissions are largely defined by the electricity input. Due to the conversion efficiency of the electrolysis process, every 100 g CO2/kWh associated with electricity supply results in nearly 5 kg CO2-eq/kg H2 in hydrogen production.100 This means that the emissions intensity of the electricity input needs to be lower than 200-240 g CO2/kWh to breakeven with the unabated natural gas route. There is a large range around the world: Countries that have a high share of hydropower today (e.g. Norway, Paraguay, Switzerland) or nuclear (e.g. France) achieve emissions intensity lower than 45 g CO2/kWh, and countries with a high share of gas and coal can have grid emissions intensity above 700 g CO2/kWh.
Nearly 85% of the global electricity production is above this breakeven threshold (on an annual average basis), which means that operating an electrolyser with electricity from the grid on a continuous basis might not make sense in most countries from an
environmental perspective.


